Hot US Stocks
Derived from the 50 most active stocks priced over $5 listed on any U.S. Exchange (NYSE, Nasdaq, OTCBB, etc.). The default setting shows stocks starting from $5.00, however any minimum and maximum price can be entered by specifying the price range below and clicking on the go button.
Min Price:
Max Price:
| Chart | Company Name | Volume | Price | High | Low | Open | Change | BI Rating |
 ^VALA
^VALA
| ^VALA | 2,447,962,701 | $2447962700 | $2447962700 | $0 | $207 |
87.56%
|

|
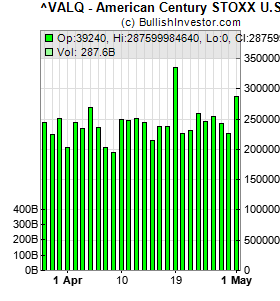 ^VALQ
^VALQ
| American Century STOXX U.S. Quality Value ETF | 968,349,773,113 | $968349773000 | $968349773000 | $0 | $3842 |
80.15%
|
|
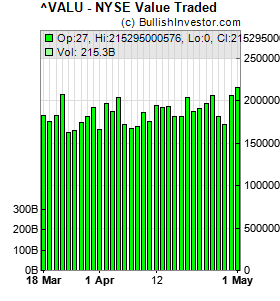 ^VALU
^VALU
| NYSE Value Traded | 495,910,452,373 | $495910452000 | $495910452000 | $0 | $377 |
59.07%
|
|
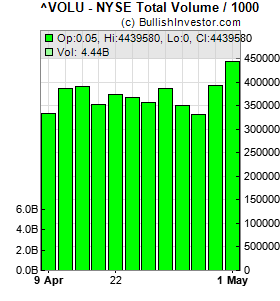 ^VOLU
^VOLU
| NYSE Total Volume / 1000 | 7,915,777,865 | $7915777 | $7915777 | $0 | $0.05 |
48.85%
|
|
 ATAI
ATAI
| AtaiBeckley Inc. | 62,090,532 | $5.29 | $5.31 | $4.4209 | $4.57 |
15.50%
|
|
 ^VOLA
^VOLA
| NYSE MKT (AMX) Total Volume / 1000 | 595,729,781 | $595729.78 | $595729.78 | $0 | $0.154 |
10.51%
|
|
 BB
BB
| BlackBerry Limited | 55,593,823 | $11.4 | $11.49 | $9.91 | $10.08 |
10.25%
|
|
 WEN
WEN
| Wendy''s Company (The) | 79,793,095 | $7.8 | $8.25 | $7.22 | $7.26 |
6.41%
|
|
 PATH
PATH
| UiPath Inc. Class A | 66,115,444 | $10.53 | $10.585 | $9.87 | $9.91 |
6.04%
|
|
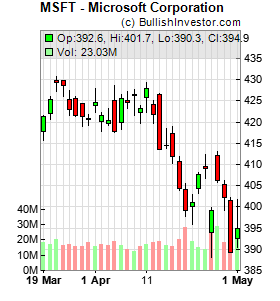 MSFT
MSFT
| Microsoft Corporation | 183,180,683 | $372.97 | $376.61 | $355.43 | $357.15 |
5.71%
|

|
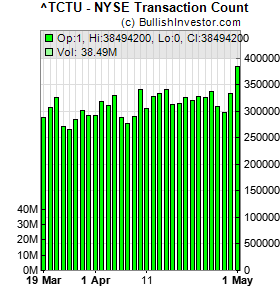 ^TCTU
^TCTU
| NYSE Transaction Count | 56,897,072 | $56897072 | $56897072 | $0 | $1 |
5.57%
|
|
 UBER
UBER
| Uber Technologies Inc. | 57,459,051 | $76.2 | $76.39 | $72.45 | $72.7 |
5.47%
|
|
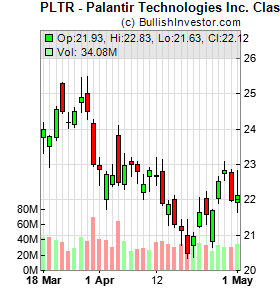 PLTR
PLTR
| Palantir Technologies Inc. | 59,753,837 | $112.93 | $114.0799 | $108.47 | $109.04 |
5.28%
|
|
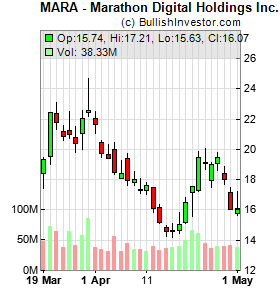 MARA
MARA
| MARA Holdings Inc. | 55,153,526 | $14.54 | $14.995 | $13.34 | $13.58 |
4.76%
|
|
 SQQQ
SQQQ
| PROSHARES TRUST | 68,602,495 | $41.31 | $41.79 | $39.69 | $41.08 |
4.66%
|
|
 NVD
NVD
| GraniteShares 2x Short NVDA Daily ETF | 85,896,455 | $5.67 | $5.705 | $5.4603 | $5.6 |
4.23%
|
|
 NFLX
NFLX
| Netflix Inc. | 74,458,753 | $73.81 | $75.2 | $71.53 | $71.69 |
4.10%
|
|
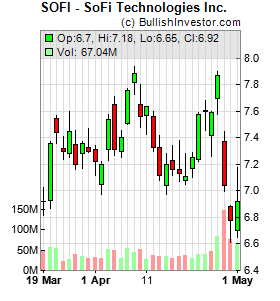 SOFI
SOFI
| SoFi Technologies Inc. | 89,990,574 | $17.88 | $17.97 | $16.99 | $17 |
3.35%
|
|
 CMG
CMG
| Chipotle Mexican Grill Inc. | 62,442,097 | $33.34 | $33.59 | $32.255 | $32.3 |
3.28%
|
|
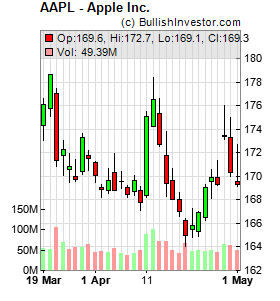 AAPL
AAPL
| Apple Inc. | 257,815,207 | $283.78 | $285.95 | $274.21 | $275 |
3.14%
|
|
 KEEL
KEEL
| Keel Infrastructure Corp. | 122,178,777 | $6.03 | $6.15 | $5.5 | $5.67 |
2.73%
|
|
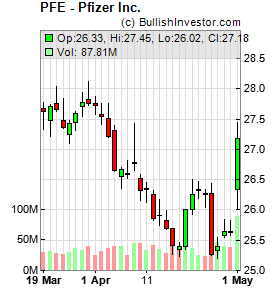 PFE
PFE
| Pfizer Inc. | 58,640,708 | $24.29 | $24.35 | $23.74 | $23.74 |
2.62%
|
|
 HL
HL
| Hecla Mining Company | 110,144,656 | $15.54 | $15.98 | $15.13 | $15.22 |
2.57%
|
|
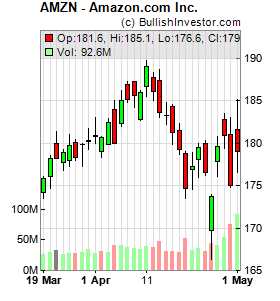 AMZN
AMZN
| Amazon.com Inc. | 243,615,629 | $232.69 | $233.9 | $226.125 | $227.39 |
2.50%
|
|
 TSLL
TSLL
| Direxion Daily TSLA Bull 2X ETF | 56,820,085 | $11.62 | $12.14 | $10.97 | $11.08 |
2.11%
|
|
 ONDS
ONDS
| Ondas Inc | 122,201,878 | $7.83 | $7.965 | $7.5 | $7.515 |
2.02%
|
|
 BMNR
BMNR
| BitMine Immersion Technologies Inc. | 65,487,856 | $13.56 | $13.805 | $12.9446 | $13 |
1.80%
|
|
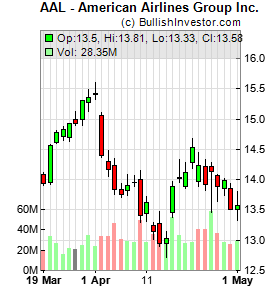 AAL
AAL
| American Airlines Group Inc. | 160,382,255 | $17.87 | $17.94 | $17.425 | $17.49 |
1.71%
|
|
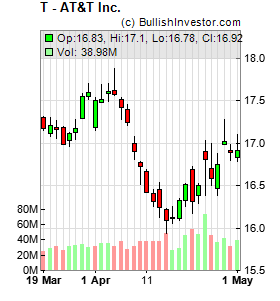 T
T
| AT&T Inc. | 84,424,647 | $22.72 | $22.72 | $22.32 | $22.47 |
1.34%
|
|
 IBIT
IBIT
| ISHARES BITCOIN TR | 58,825,716 | $33.85 | $34.26 | $33.25 | $33.28 |
0.98%
|
|
 BITO
BITO
| ProShares Bitcoin ETF | 232,527,030 | $8.12 | $8.2299 | $7.99 | $8 |
0.74%
|
|
 SPDN
SPDN
| Direxion Daily S&P 500 Bear 1X | 59,148,345 | $8.87 | $8.905 | $8.7901 | $8.88 |
0.45%
|
|
 CDE
CDE
| Coeur Mining Inc. | 165,496,321 | $16.02 | $16.9192 | $15.755 | $16.02 |
0.19%
|
|
 SPCX
SPCX
| Space Exploration Technologies Corp. | 126,204,874 | $153.23 | $158.4 | $148.51 | $150.62 |
0.15%
|
|
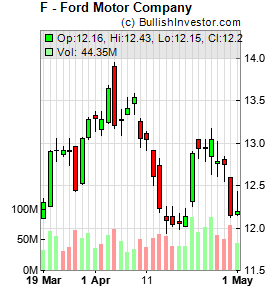 F
F
| Ford Motor Company | 59,323,794 | $14.13 | $14.48 | $13.97 | $13.98 |
0.14%
|
|
 JOBY
JOBY
| Joby Aviation Inc. | 55,536,807 | $8.83 | $9.08 | $8.7 | $8.76 |
-0.45%
|
|
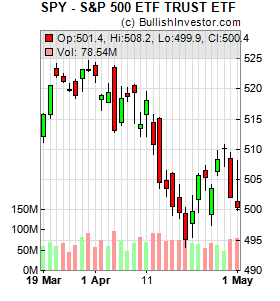 SPY
SPY
| State Street SPDR S&P 500 ETF Trust | 66,343,400 | $728.99 | $736.53 | $716.58 | $728.945 |
-0.72%
|

|
 WULF
WULF
| TeraWulf Inc. | 65,271,933 | $25.83 | $26.845 | $24.435 | $25.2 |
-0.88%
|
|
 NWL
NWL
| Newell Brands Inc. | 80,389,597 | $5.82 | $6.156 | $5.645 | $5.85 |
-1.19%
|
|
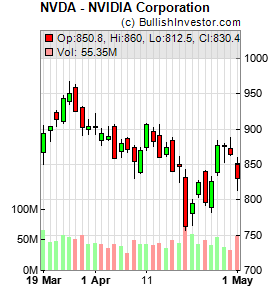 NVDA
NVDA
| NVIDIA Corporation | 175,581,332 | $192.53 | $195.55 | $191.22 | $193.12 |
-1.64%
|
|
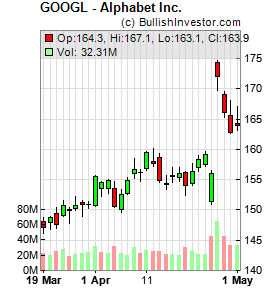 GOOGL
GOOGL
| Alphabet Inc. | 112,515,765 | $337.39 | $346.36 | $330.2 | $342.55 |
-1.84%
|
|
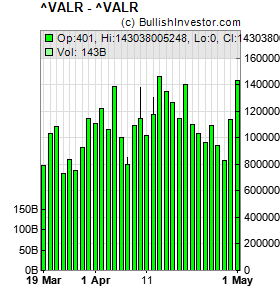 ^VALR
^VALR
| ^VALR | 147,743,536,587 | $147743536000 | $147743536000 | $0 | $155 |
-2.02%
|
|
 GOOG
GOOG
| Alphabet Inc. | 81,332,118 | $334.69 | $344.12 | $333.69 | $340.98 |
-2.19%
|
|
 IONQ
IONQ
| IonQ Inc. | 66,727,983 | $49.31 | $52.478 | $48.49 | $49.65 |
-2.47%
|
|
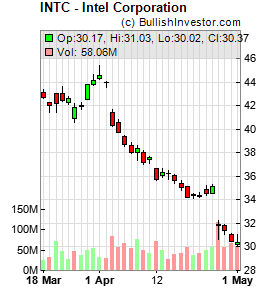 INTC
INTC
| Intel Corporation | 97,715,153 | $128.32 | $131.23 | $125.5 | $128.705 |
-3.42%
|
|
 TQQQ
TQQQ
| PROSHARES TRUST | 68,875,553 | $71.83 | $74.69 | $70.72 | $72.085 |
-4.16%
|
|
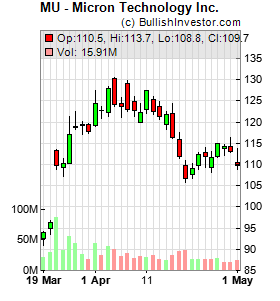 MU
MU
| Micron Technology Inc. | 84,925,493 | $1132.33 | $1198.71 | $1121.36 | $1139.08 |
-6.69%
|
|
 NOK
NOK
| Nokia Corporation Sponsored American Depositary Shares | 142,187,146 | $13.01 | $13.44 | $12.78 | $13.44 |
-6.94%
|
|
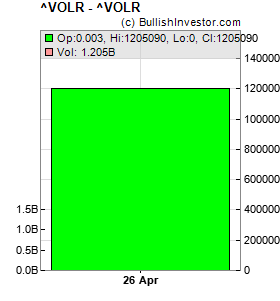 ^VOLR
^VOLR
| ^VOLR | 2,865,880,335 | $2865880 | $2865880 | $0 | $0.023 |
-10.81%
|
|
 BE
BE
| Bloom Energy Corporation Class A | 56,777,391 | $252.02 | $298.53 | $247.74 | $294.52 |
-18.49%
|
|